install.packages("pacman")7 Human geography lab 1
7.1 Shapefile in GIS
Shapefile is important for GIS (Geographic Information System) due to its widespread use and compatibility with various software applications.
A shapefile is a vector data format for storing geometric location and attribute information of geographic features. It’s a set of related files, including .shp, .shx, and .dbf, which together define the shape and attributes of features like points, lines, and polygons. Shapefiles are commonly used in GIS software for data interoperability and analysis.
Shapefiles are created by Environmental Systems Research Institute (ESRI) and are used for storing spatial data.
7.2 Shapefile and R
Shapefile is commonly used with R, a powerful programming language and software environment for statistical computing and graphics. Here’s why shapefile is often preferred for use with R:
Native Support: R has built-in support for reading, writing, and manipulating shapefiles. The “sf” package in R provides functions specifically designed for working with spatial data, including shapefiles. This native support simplifies the process of loading shapefiles into R and performing various spatial analyses.
Visualization Capabilities: R offers extensive visualization capabilities for geospatial data. Packages like “ggplot2” and “leaflet” enable you to create high-quality maps and interactive visualizations using shapefiles as the data source. R’s flexibility in customizing plots allows for advanced geospatial visualizations and exploration.
While shapefile is a common choice for working with spatial data in R, it’s important to note that R also supports other geospatial file formats, such as GeoJSON and Geopackage. These formats may offer advantages like improved data compression, support for more advanced spatial features, and better inter-operability with certain software ecosystems.
Use
pacmanto manage the R packagesUsing
packmanpackage enables us to install and load a package without typinginstall.packges()at Console on your RStudioYou need to type the following command at Console on your RStudio
- The installation of necessary R packages:
pacman::p_load(sf, tidyverse, rnaturalearth)7.3 Using sf package to make map
- Create data for world
world <- ne_countries(scale = "small", returnclass = "sf")- First we use the familiar ggplot2 syntax. Like in any other ggplot, we have an x and a y axis, though in this case the correspond to longitude and latitude. Knowing this, we can use other ggplot2 commands to make our map more complex. Below we draw a horizontal line where the
yinterceptis at the equator.
world %>%
  ggplot() +
  geom_sf() +
geom_hline(yintercept = 0, linetype = "dashed") 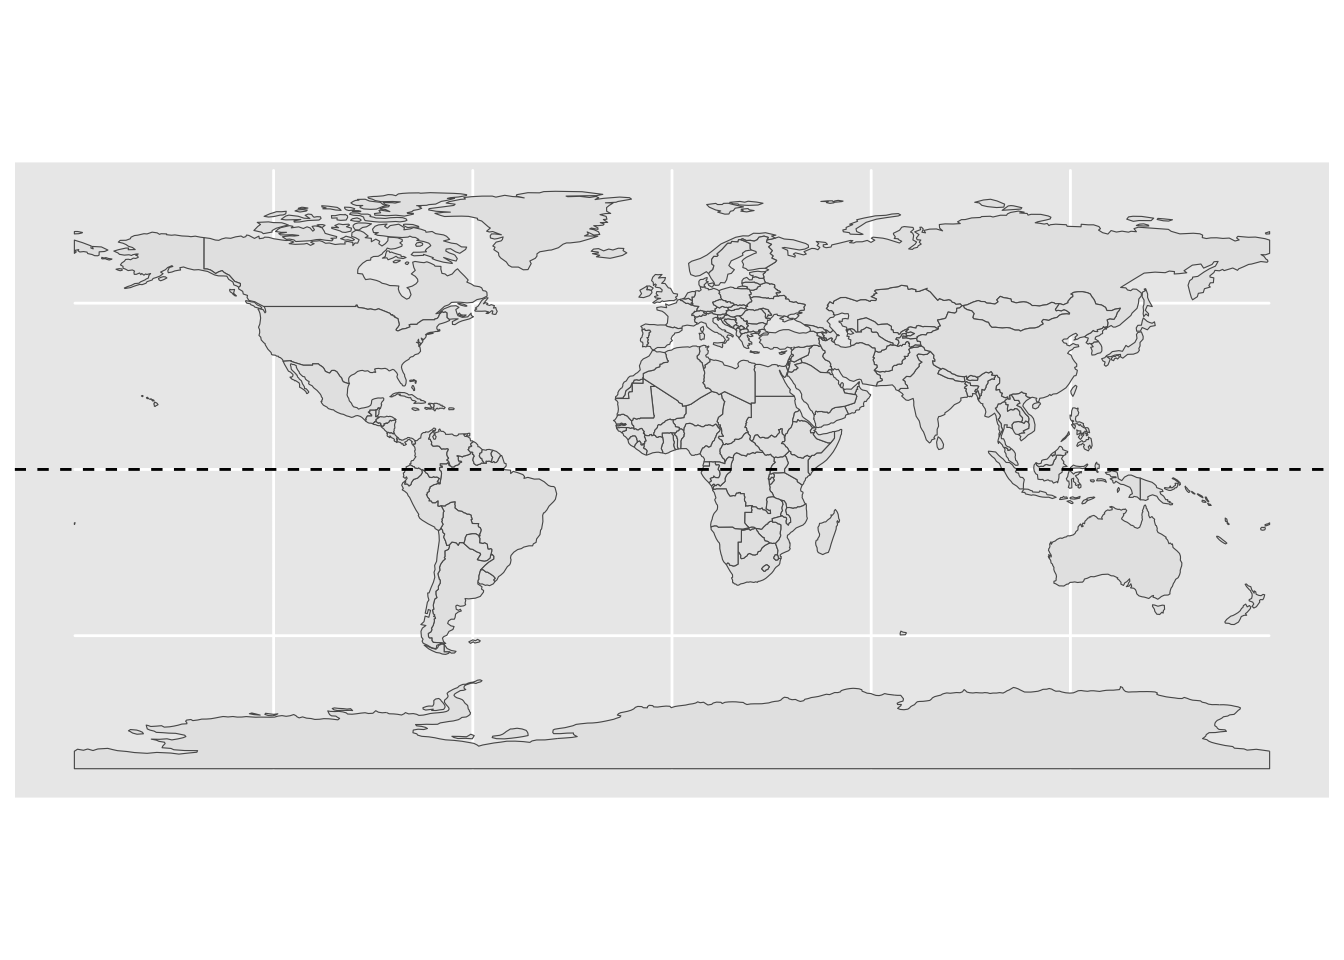
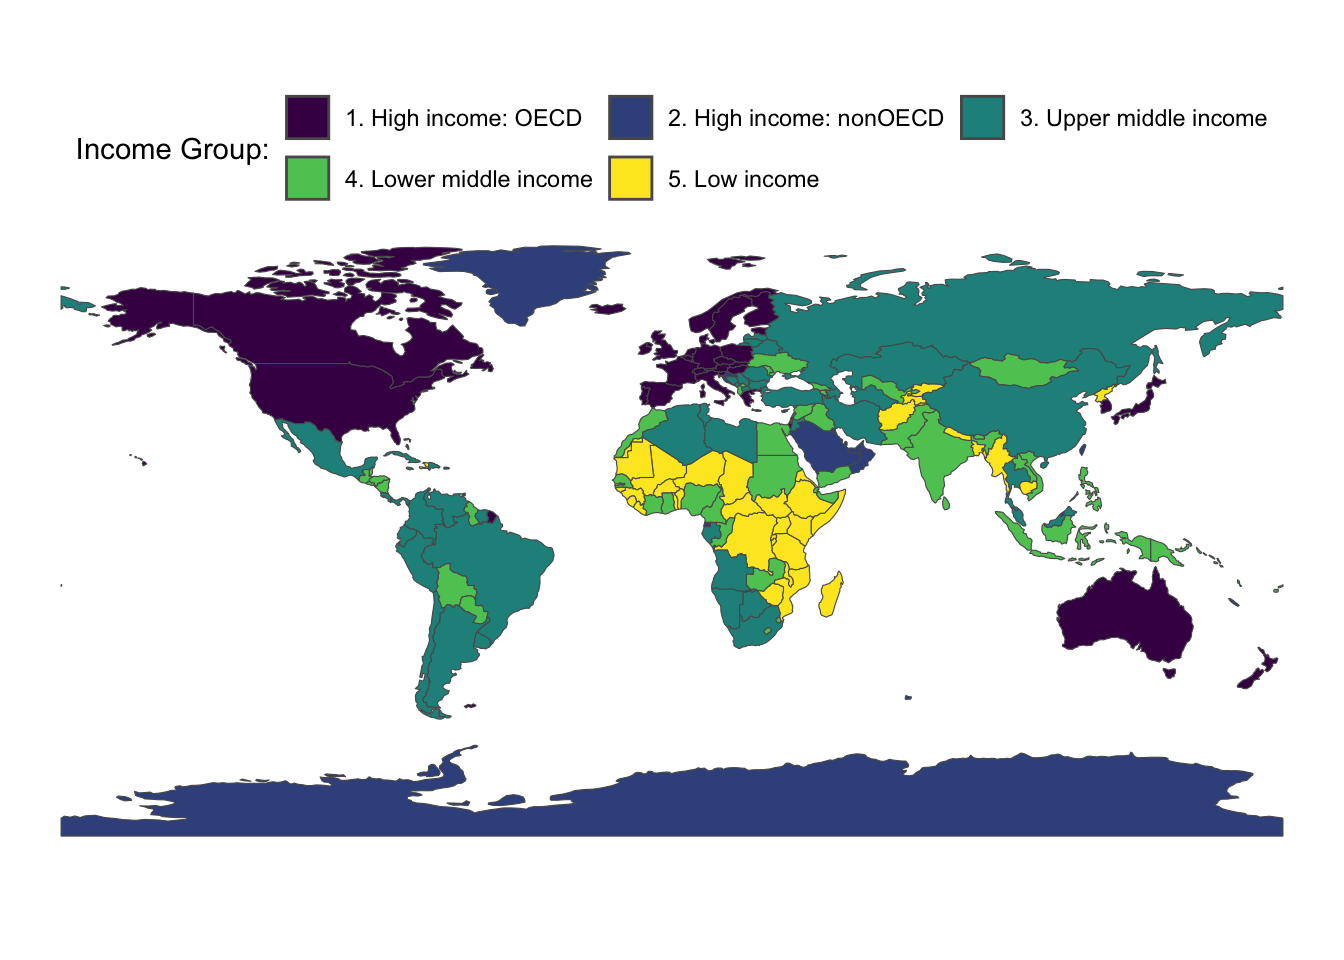
- World map with income groups
world %>%
  mutate(income_grp = factor(income_grp, ordered = T)) %>%
  ggplot() +
  geom_sf(aes(fill = income_grp)) +
  theme_void() +
  theme(legend.position = "top") +
  labs(fill = "Income Group:") +
  guides(fill=guide_legend(nrow=2, byrow=TRUE))