pacman::p_load(usmap, tidyverse)19 Human geography lab: Annex 4
19.1 US states and regions
I will explore different packages that could help with mapping geographical data, specifically for the USA. At first we need to load necessary packages to execute the maps for this lecture.
- Alternatively you can use the pacman package manager for loading the necessary packages for this lecture.
pacman::p_load(usmap, maps, mapdata, sf, plotly, tidyverse, mapview, leaflet, tmap, tmaptools, tigris)19.2 Using usmap package
- This is probably the most continent package to plot a USA. map along with some data. Plot all states of the USA to create an empty map.
plot_usmap(regions = "states") +
  labs(title = "United States",
       subtitle = "This is a map of the United States.") +
  theme(panel.background=element_blank())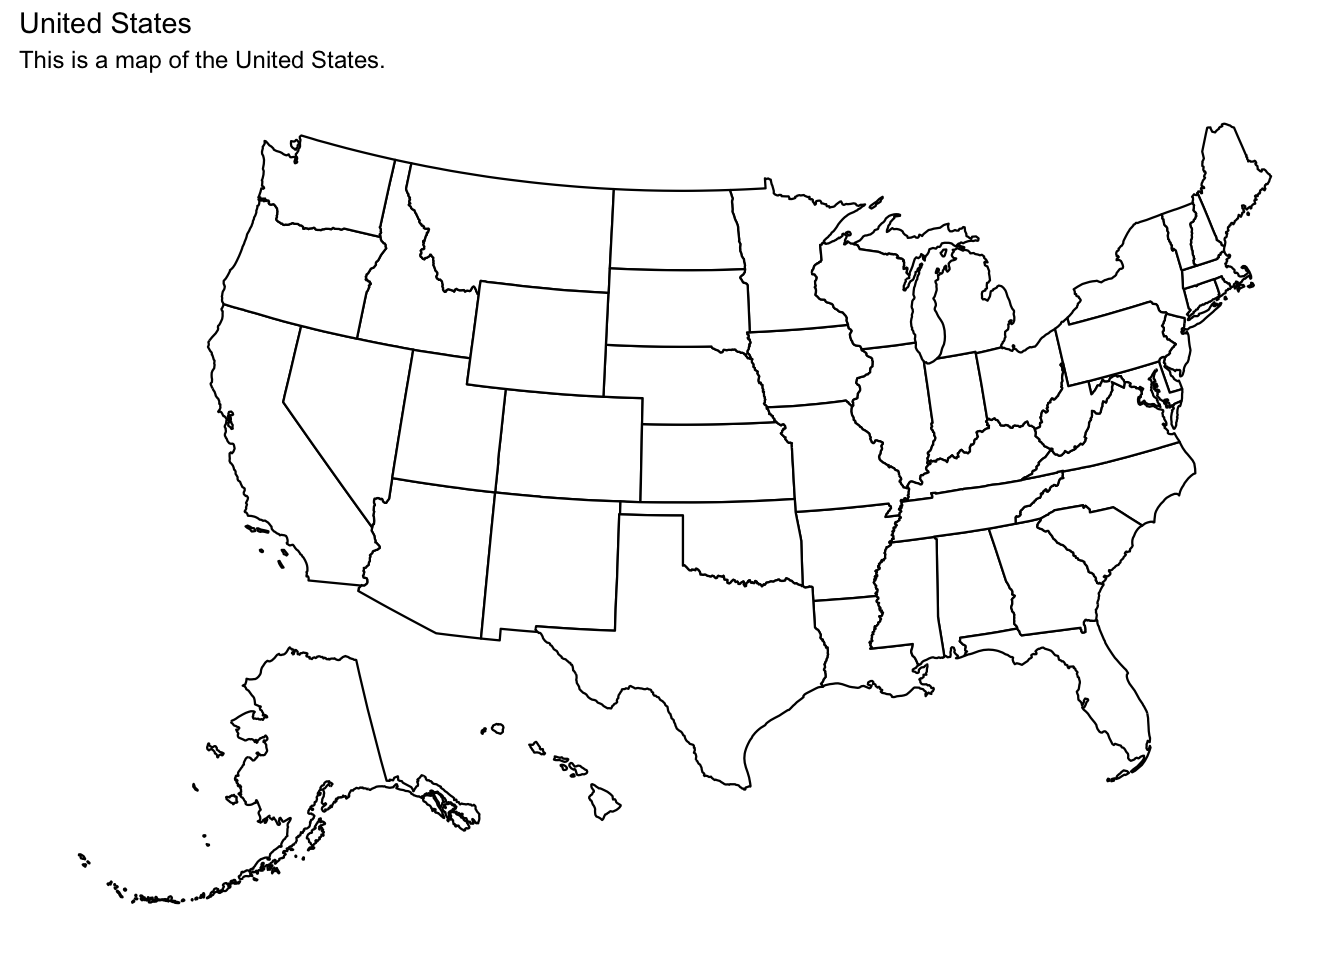
- Besides states, we could also plot all counties of the USA.
plot_usmap(regions = "counties") +
  labs(title = "U.S.A. counties",
       subtitle = "This is a map of the United States.") +
  theme(panel.background=element_blank())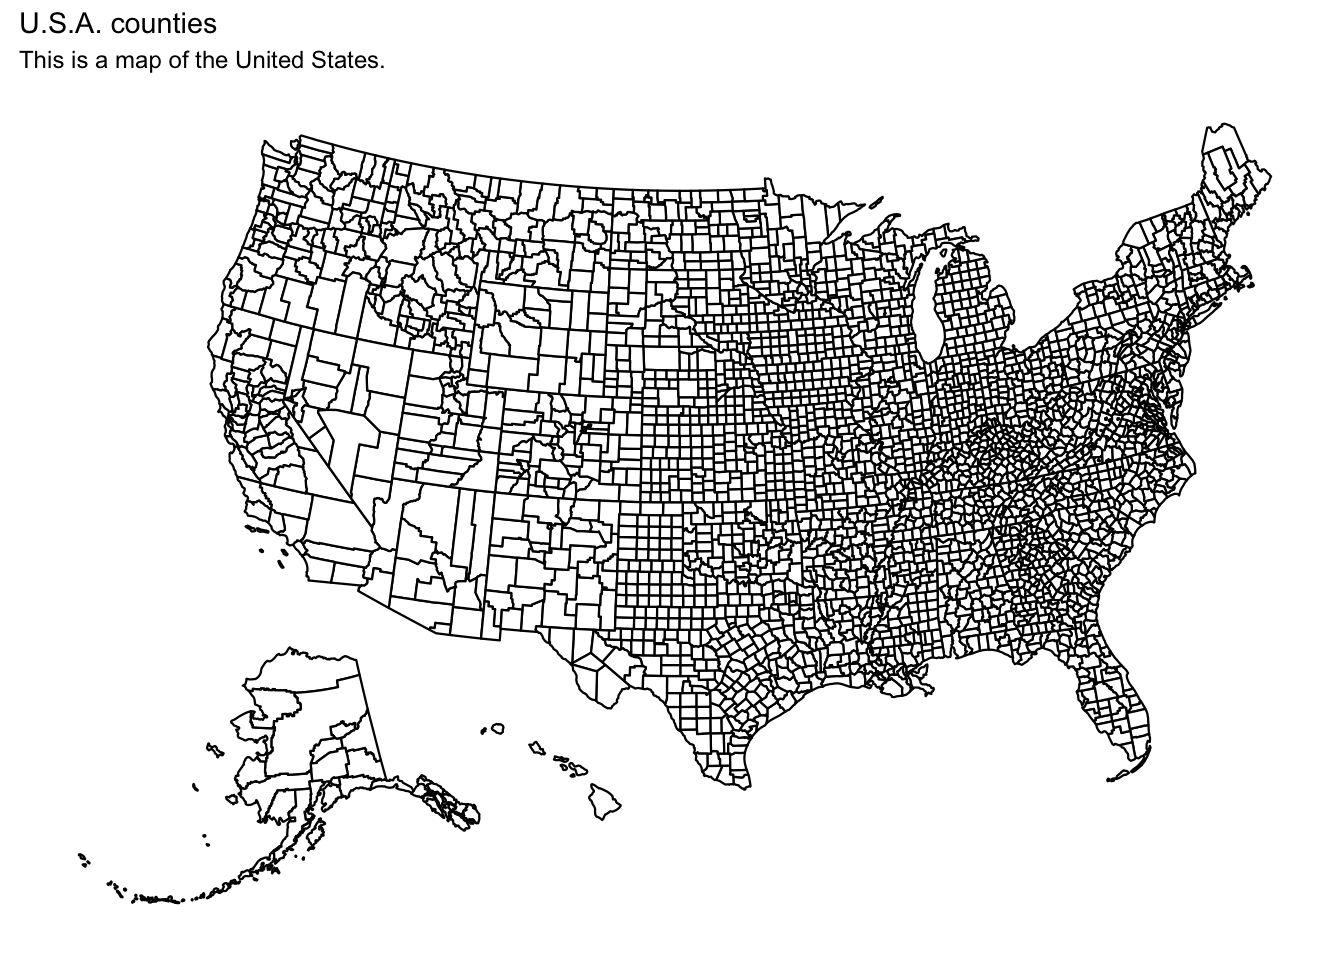
usmapalso provides many different regions to select
plot_usmap(include = .south_region, exclude = c("VA"), labels = TRUE)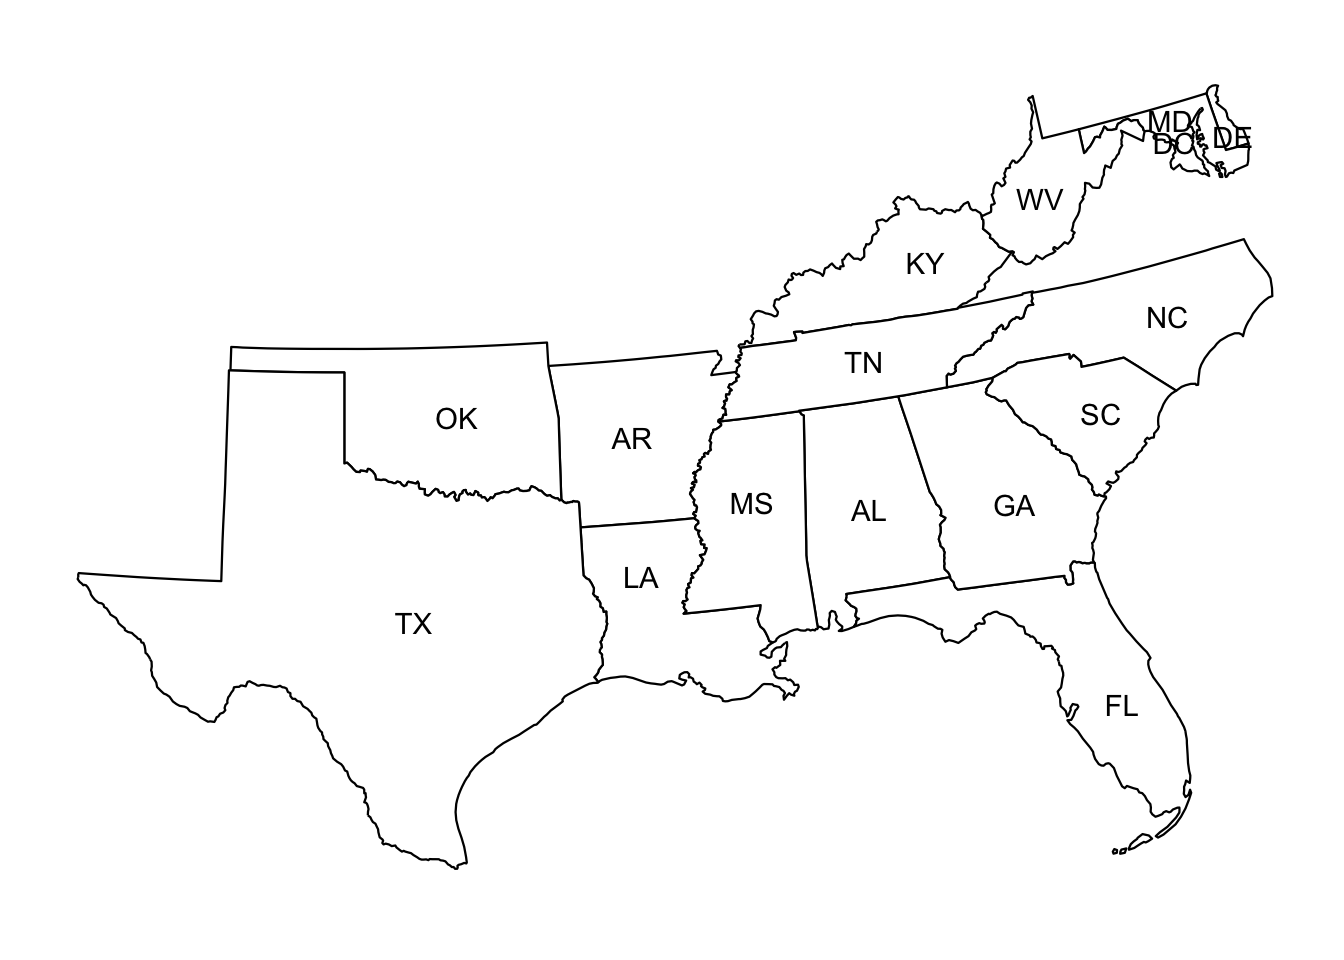
usmapalso provides north regions map
plot_usmap(include = .south_region, exclude = c("VA"), labels = TRUE)
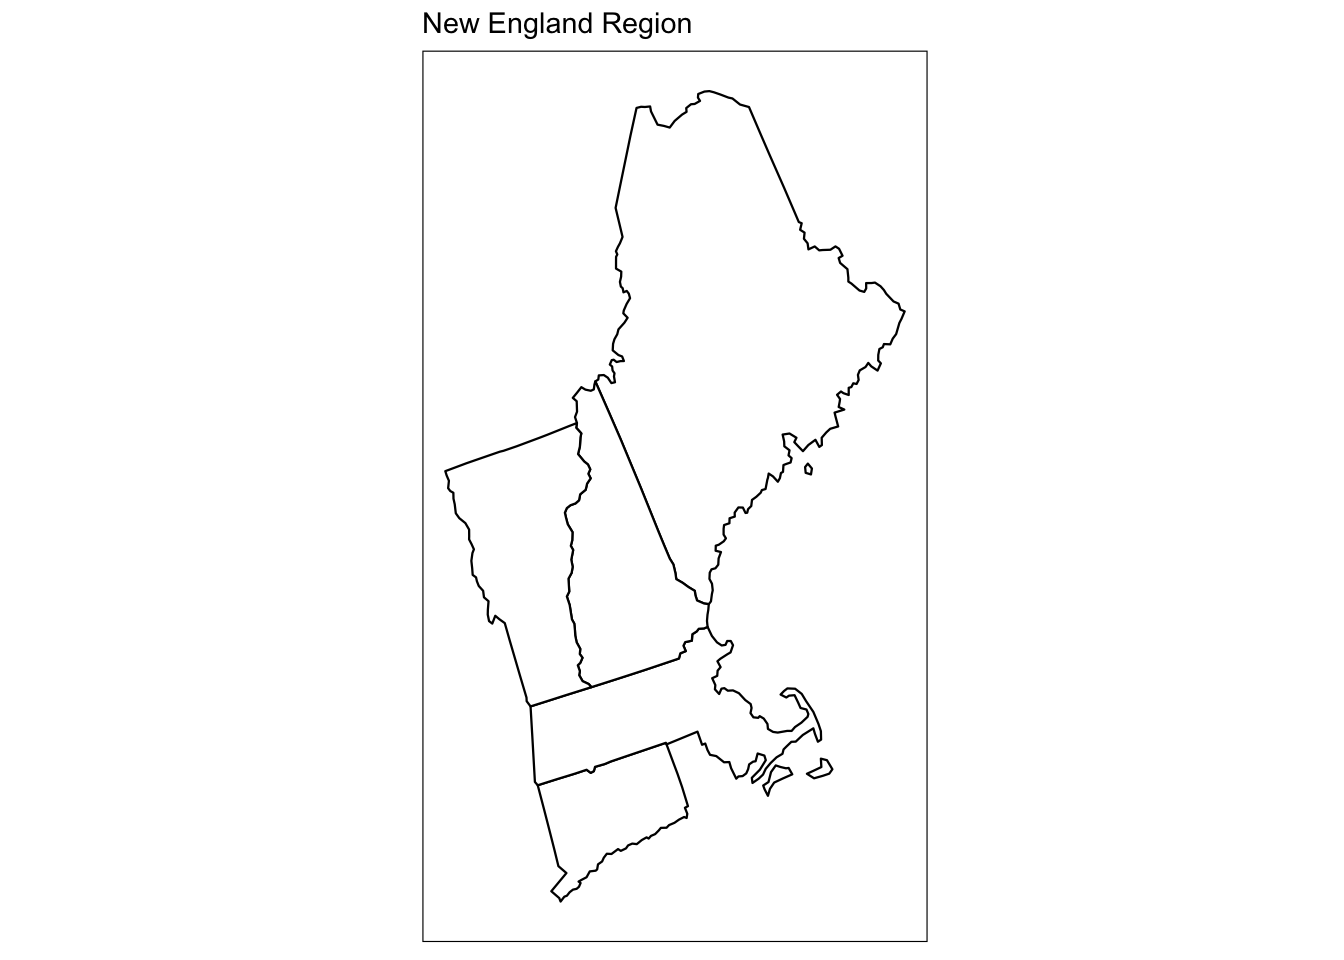
- We can also select certain states by using state abbreviations
plot_usmap(include = c("CT", "ME", "MA", "NH", "VT")) +
  labs(title = "New England Region") +
  theme(panel.background = element_rect(color = "black"))