pacman::p_load(usmap, tidyverse)20 Human geography lab: Annex 5
20.1 Using ggplot2 package
usa <- map_data('usa')- Next, we use geom_ploygon function to plot USA map.
ggplot(data=usa, aes(x=long, y=lat, group=group)) +
  geom_polygon(fill='lightblue') +
  theme(axis.title.x=element_blank(), axis.text.x=element_blank(), axis.ticks.x=element_blank(),
        axis.title.y=element_blank(), axis.text.y=element_blank(), axis.ticks.y=element_blank()) +
  ggtitle('U.S.A. Map') +
  coord_fixed(1.3)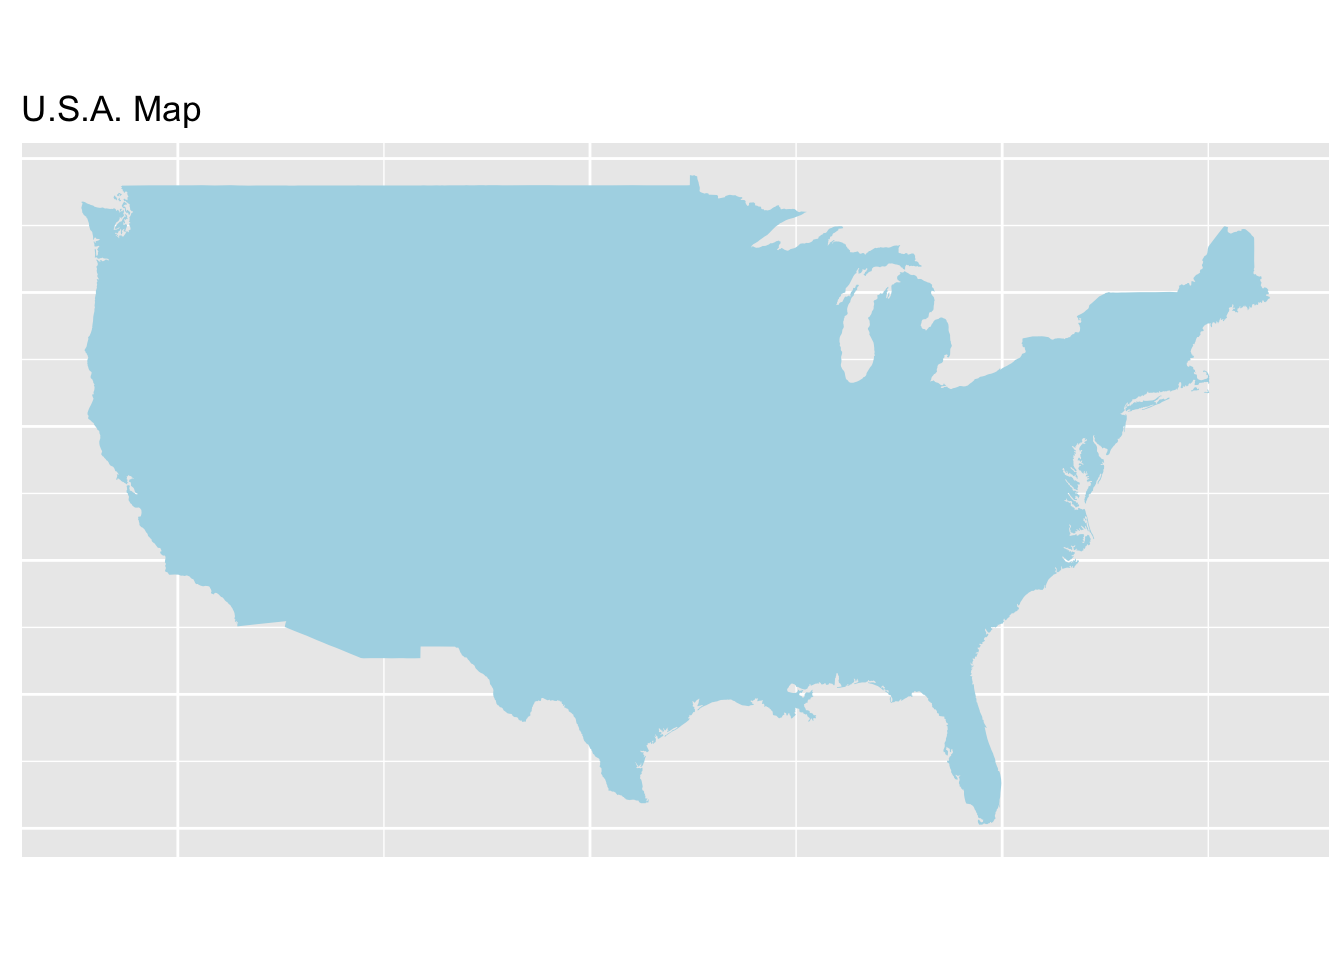
- In order to get more information about USA, now we can add state data to the map. Like above, we obtain data from maps and mapdata packages, and use
ggplot2to plot.
state <- map_data("state")- Plot the states with
ggplot2
ggplot(data=state, aes(x=long, y=lat, fill=region, group=group)) +
  geom_polygon(color = "white") +
  guides(fill=FALSE) +
  theme(axis.title.x=element_blank(), axis.text.x=element_blank(), axis.ticks.x=element_blank(),
        axis.title.y=element_blank(), axis.text.y=element_blank(), axis.ticks.y=element_blank()) +
  ggtitle('U.S.A. Map with States') +
  coord_fixed(1.3)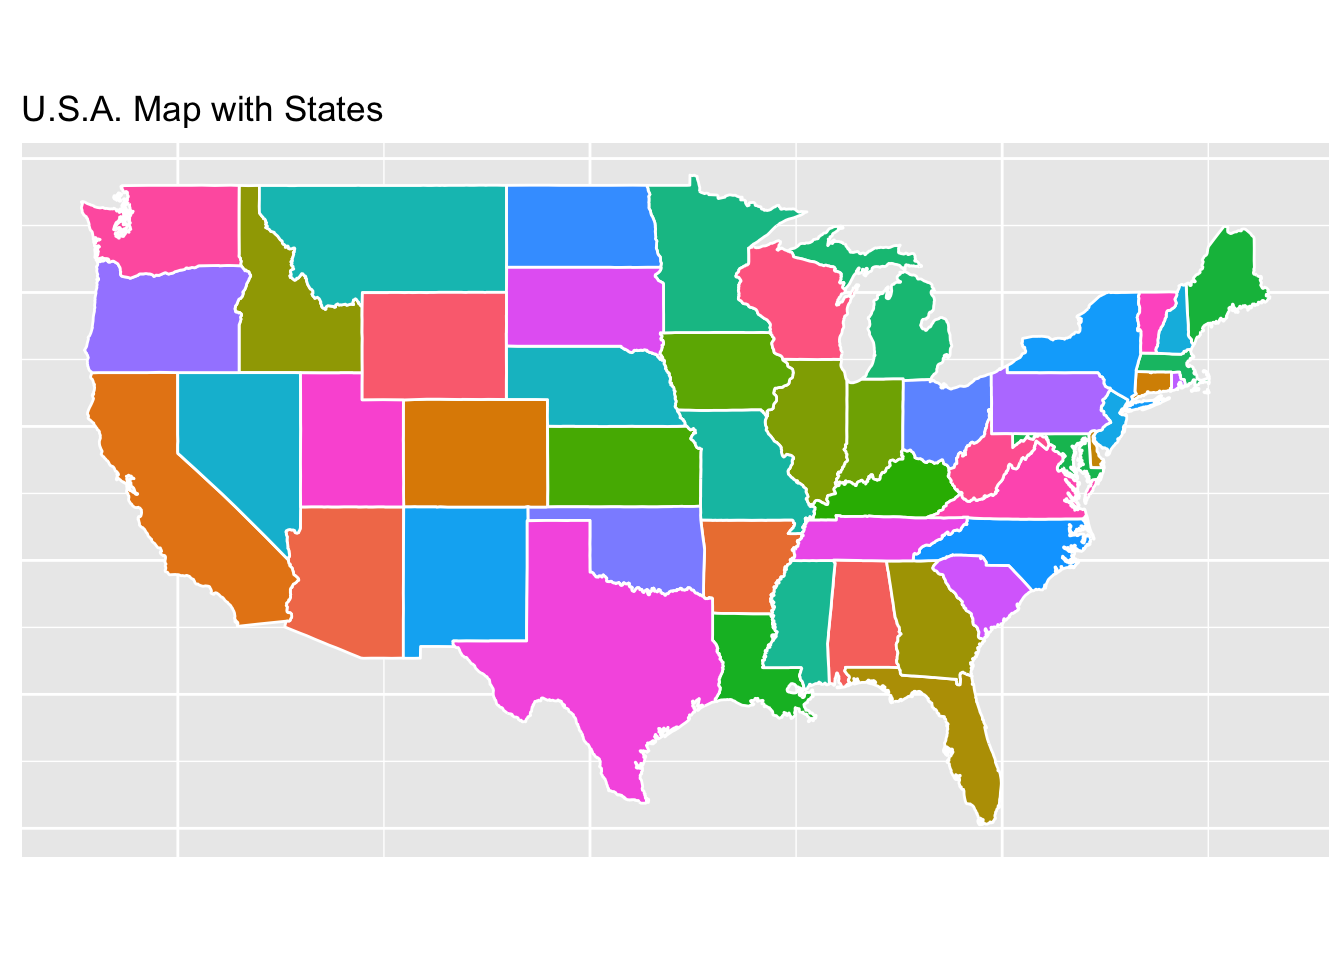
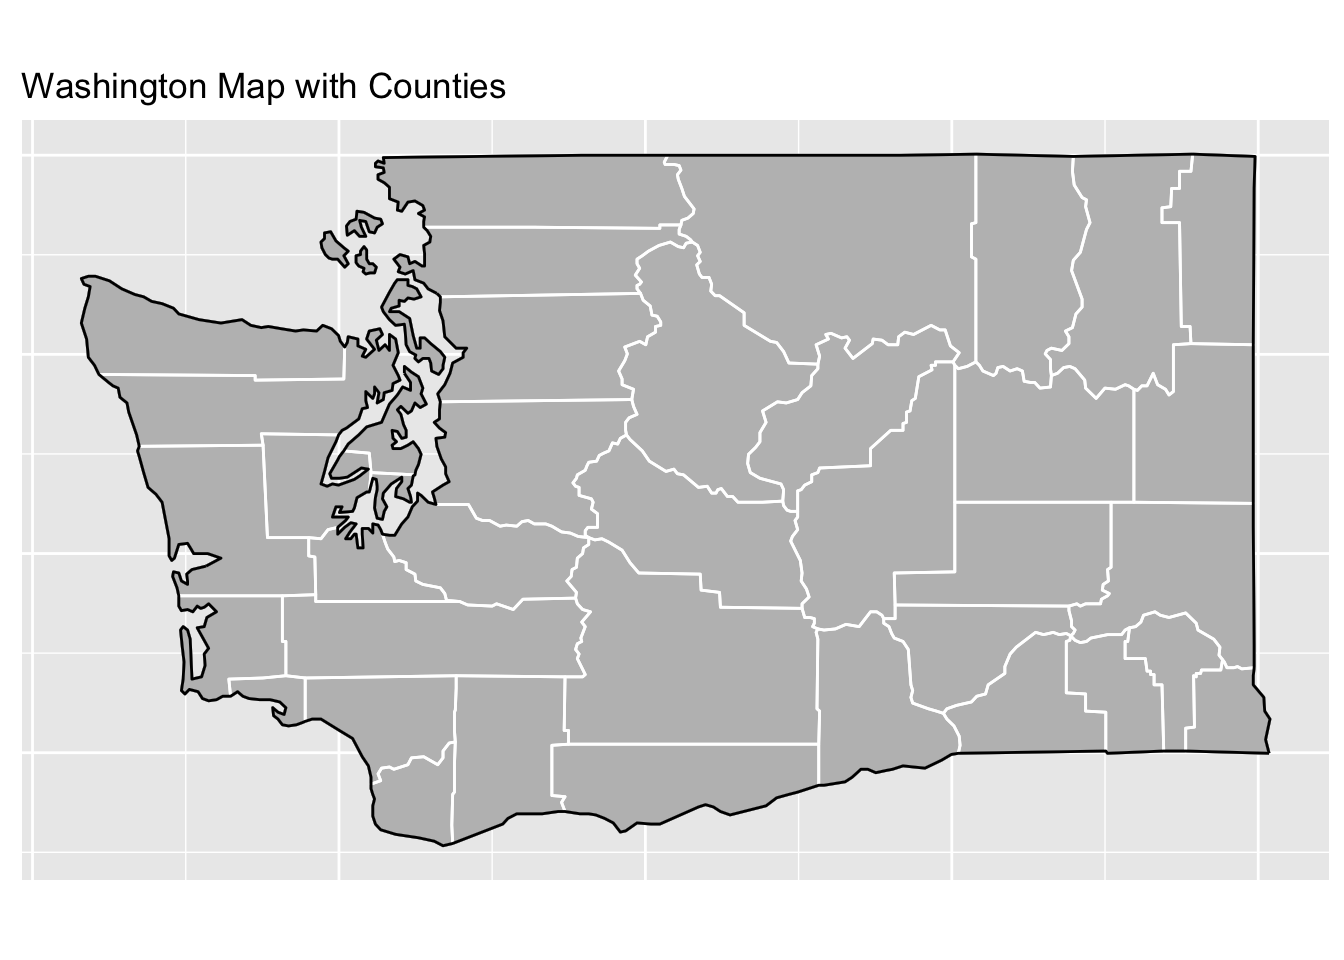
- What if we only care about one state? Definitely, we can draw one state map using
ggplot2. Firstly we need to filter data.
washington <- subset(state, region=="washington")
counties <- map_data("county")
washington_county <- subset(counties, region=="washington")- Plot Washington
ca_map <- ggplot(data=washington, mapping=aes(x=long, y=lat, group=group)) +
  coord_fixed(1.3) +
  geom_polygon(color="black", fill="gray") +
  geom_polygon(data=washington_county, fill=NA, color="white") +
  geom_polygon(color="black", fill=NA) +
  ggtitle('Washington Map with Counties') +
  theme(axis.title.x=element_blank(), axis.text.x=element_blank(), axis.ticks.x=element_blank(),
        axis.title.y=element_blank(), axis.text.y=element_blank(), axis.ticks.y=element_blank())
ca_map