pacman::p_load(maps, usmap, tidyverse, DT)17 Human geography lab: Annex 2
I will explore different packages that could help with mapping geographical data, specifically for the USA. At first we need to load necessary packages to execute the maps for this lecture.
17.0.1 EXPANSION OF WALMART
Walmart has become one of the largest retail multinational companies in the world. Table shows the names and descriptions of variables in the Walmart store opening data, walmart.csv.
walmart <- read.csv("data/csv/walmart.csv")
## red = Wal-MartStore, green = SuperCenter, blue = DistributionCenter
walmart$storecolors <- NA # create an empty vector
walmart$storecolors[walmart$type == "Wal-MartStore"] <-
    rgb(red = 1, green = 0, blue = 0, alpha = 1/3)
The DT package (an interface to the DataTables JavaScript library) can display R matrices or data frames as interactive HTML tables that support filtering, pagination, and sorting.
library(DT)
datatable(walmart)
The data set contains three different types of stores, represented by the variable type. Wal-MartStore represents a standard Walmart store, whereas SuperCenter is a standard Walmart store as well as a full supermarket. Walmart Supercenters often include pharma- cies, garden shops, car service centers, and other specialty centers. We also plot DistributionCenter data, representing stores that distribute food and goods to standard Walmart stores and Supercenters.
walmart$storecolors[walmart$type == "SuperCenter"] <-
    rgb(red = 0, green = 1, blue = 0, alpha = 1/3)
walmart$storecolors[walmart$type == "DistributionCenter"] <-
    rgb(red = 0, green = 0, blue = 1, alpha = 1/3)
## larger circles for DistributionCenter
walmart$storesize <- ifelse(walmart$type == "DistributionCenter", 1, 0.5)
Finally, we create a map and add Walmart store locations to it. We also include a legend using the legend() function. To use this function, we specify the location of the legend by setting the x and y coordinates and provide a vector of legend texts as the legend argument.
## map with legend
maps::map(database = "state")
points(walmart$long, walmart$lat, col = walmart$storecolors,
       pch = 19, cex = walmart$storesize)
legend(x = -120, y = 32, bty = "n",
       legend = c("Walmart", "Supercenter", "Distribution center"),
       col = c("red", "green", "blue"), pch = 19, # solid circles
       pt.cex = c(0.5, 0.5, 1)) # size of circles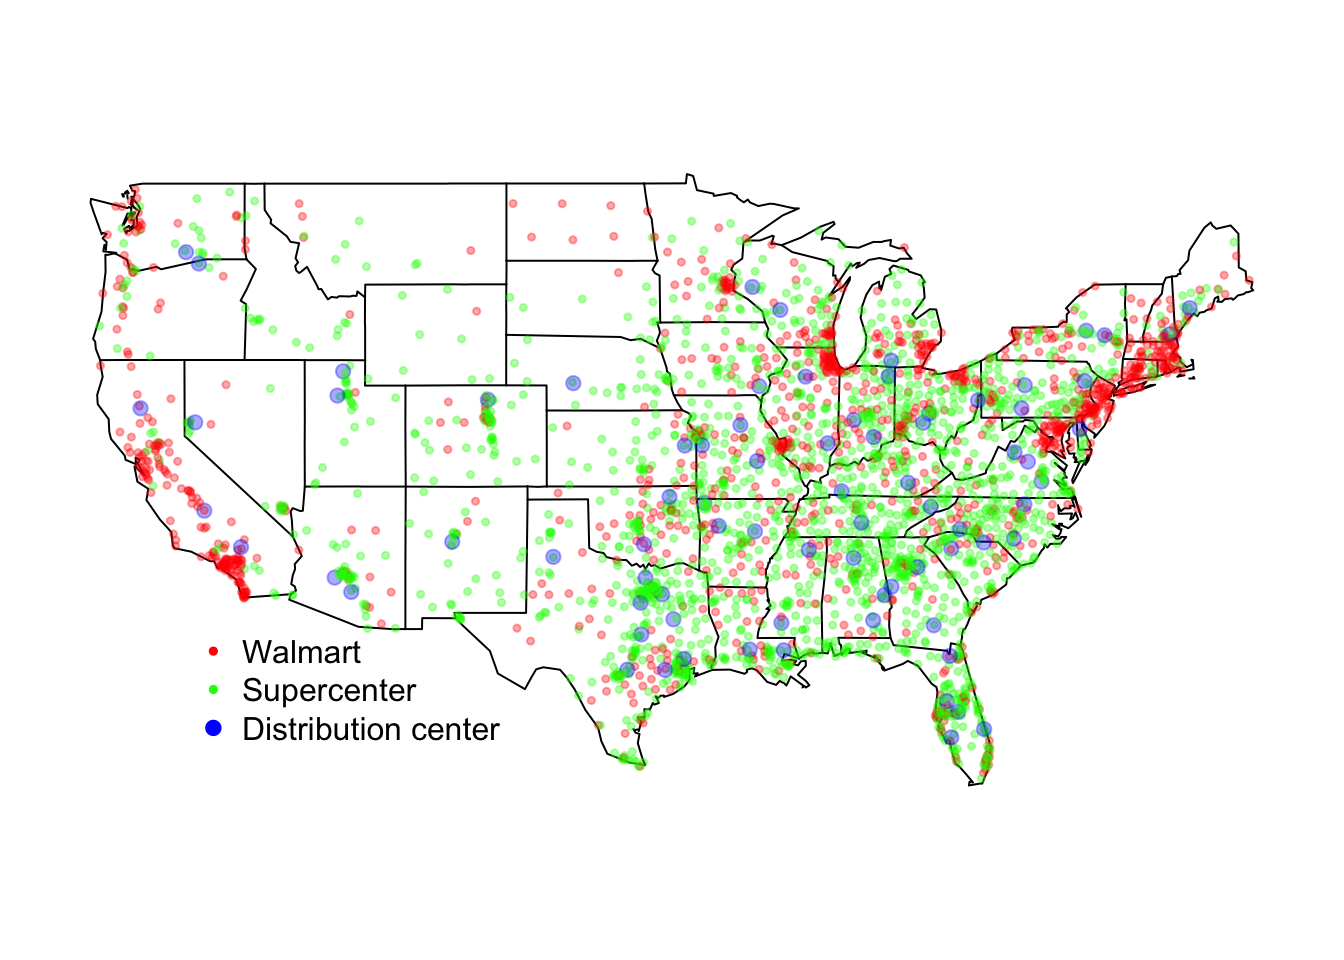
walmart.map <- function(data, date) {
    walmart <- subset(data, subset = (opendate <= date))
    maps::map(database = "state")
    points(walmart$long, walmart$lat, col = walmart$storecolors,
pch = 19, cex = walmart$storesize)
}walmart$opendate <- as.Date(walmart$opendate)
walmart.map(walmart, as.Date("1974-12-31"))
title("1975")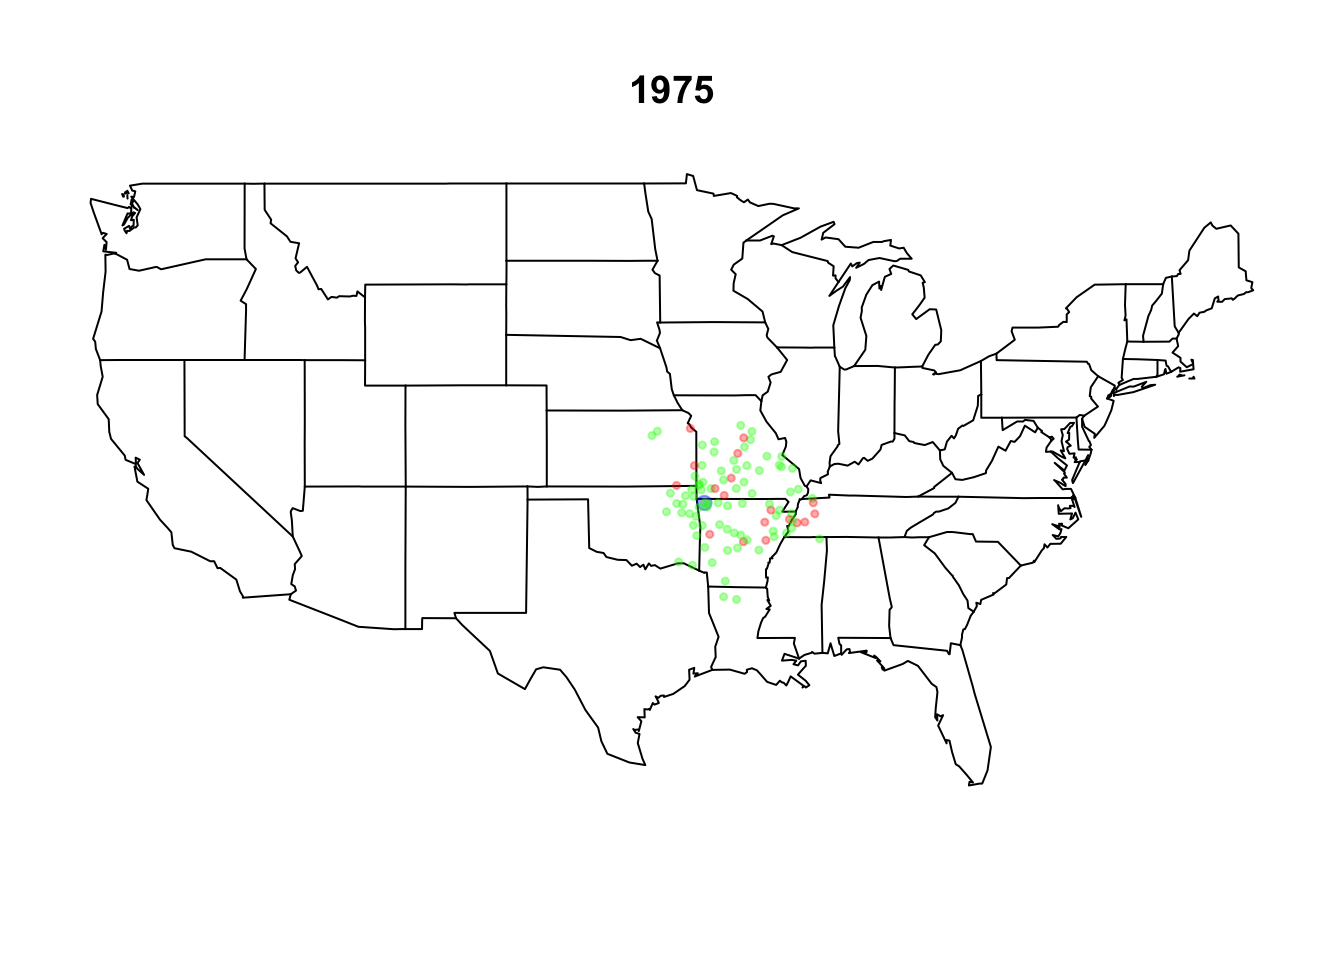
walmart.map(walmart, as.Date("1984-12-31"))
title("1985")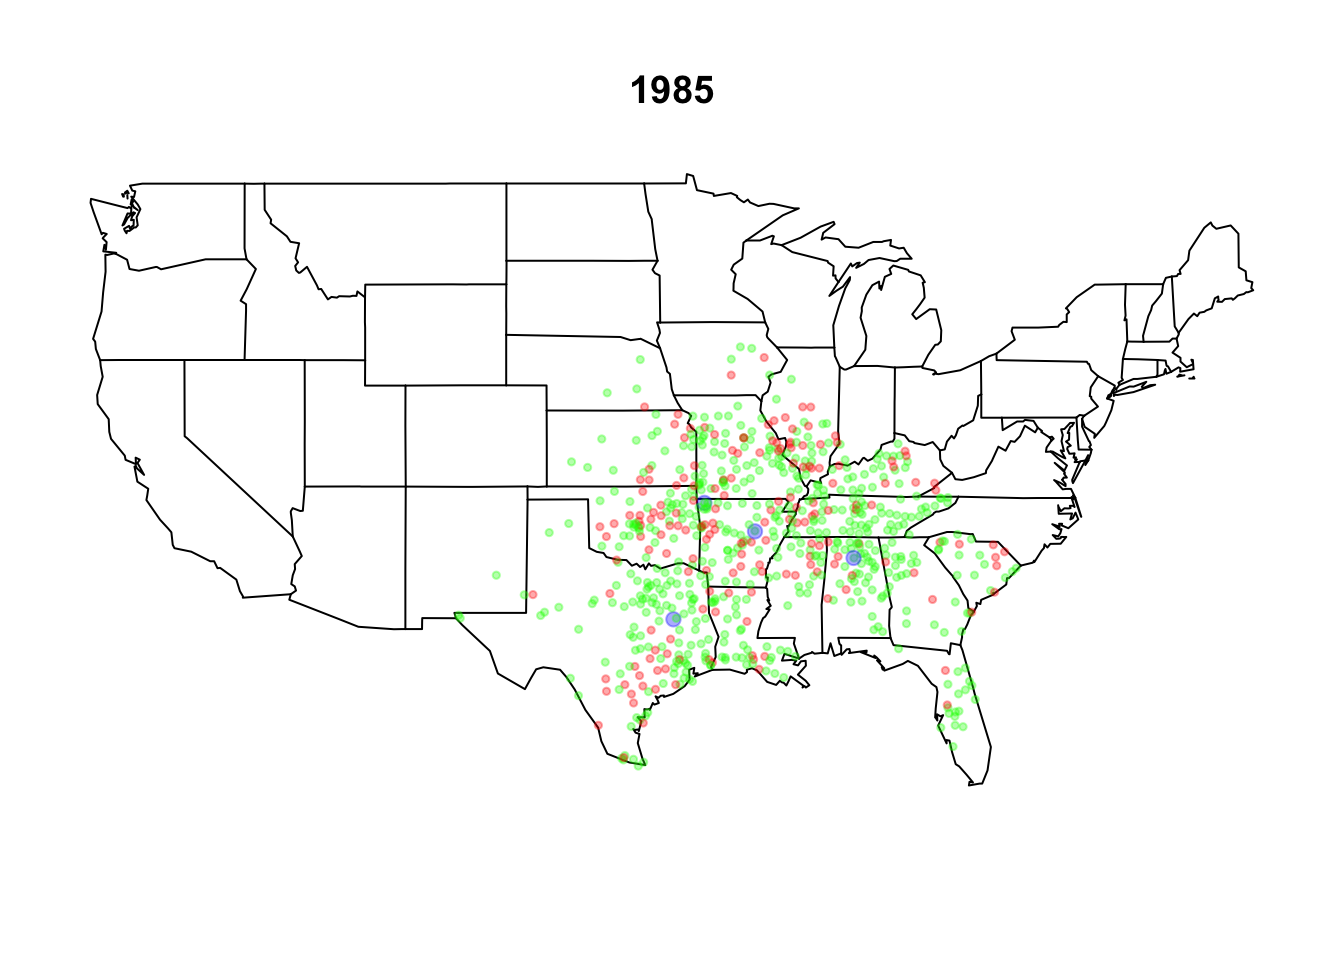
walmart.map(walmart, as.Date("1994-12-31"))
title("1995")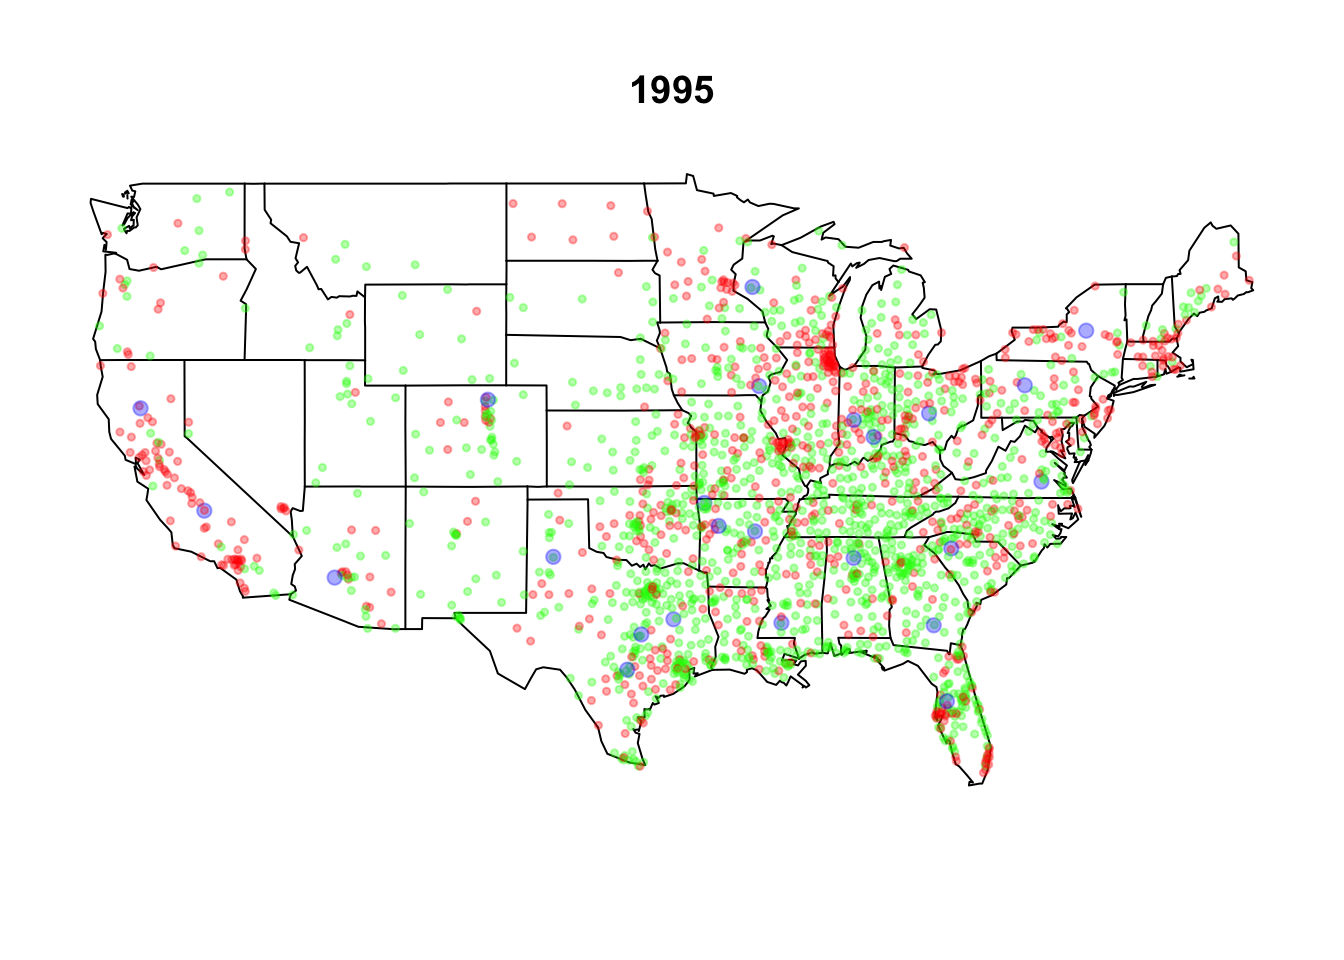
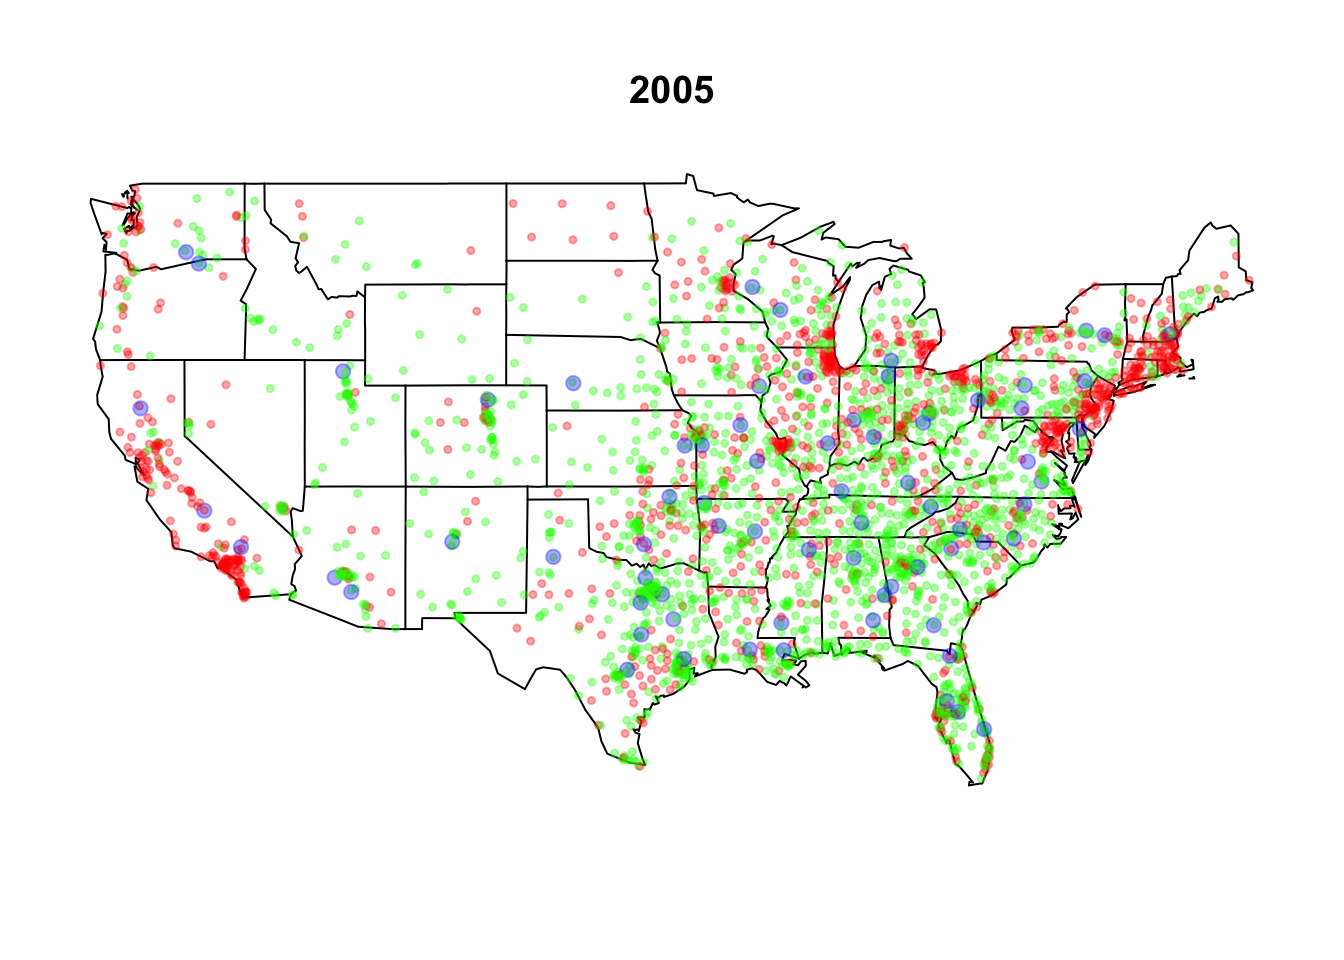
walmart.map(walmart, as.Date("2004-12-31"))
title("2005")